ELK series: Monitoring MySQL database with ELK stack
November 5, 2018 Leave a comment
In an effort to diversify the blog content, I am introducing new series about other technologies than Cisco, that make the life of a network engineer easier.
These technologies include but not limited to Juniper, logging analysis with ELK stack, Docker swarm, Kubernetes, Rancher, DevOps, Public Clouds (AWS, GCP…), Linux, Python programming, etc…
In this post we will see how to deploy ELK stack using docker-compose to analyse MySQL container database running under Rancher.
If you find it overwhelming to combine all these technologies in a single lab, don’t be afraid and try them individually in small steps.
Pre-requisites
In this lab we will be using many technologies, each of them could take a whole tutorial, nevertheless, a basic prior knowledge of the below topics will help you take advantage of this post:
-
- Basic knowlege of Docker: running containers, docker-compose, swarm clustering and service deployment.
- Basic knowlege of mysql and mysql queries.
- Basic knowlege of ELK stack (Elasticsearch, Logstash and Kibana).
Note: This lab uses temporary cloud resources, so all mentioned public IPs are not available anymore.
Outline:
- Rancher
- Starting Rancher
- Adding cluster nodes
- MySQL db
- Starting mysql service
- Loading a fake mysql database
- ELK stack
- Running ELK stack containers
- Configuring the pipeline on logstash
- Analysing data with Kibana
Let’s start by defining what is ELK stack:
- Elasticsearch: a search and analytics engine.
- Logstash: performs data processing pipeline (input->parse(filter)->output) that ingests data from a multitude of sources simultaneously, transforms it, and then sends it to your favorite search and analytics engine.
- Kibana: allows to visualize Elasticsearch data.
Rancher
Starting Rancher
Rancher is a Docker cluster orchestrator. With rancher is is easier to manager cluster nodes, service deployment, upgrade and scheduling.
All you have to do is start rancher container. That’s it!
docker run -d --restart=unless-stopped -p 8080:8080 rancher/server:stable
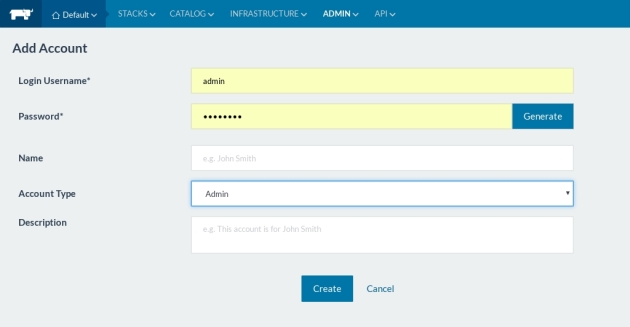
As soon as you are logged in, make sure to set login and a password:

Adding cluster nodes
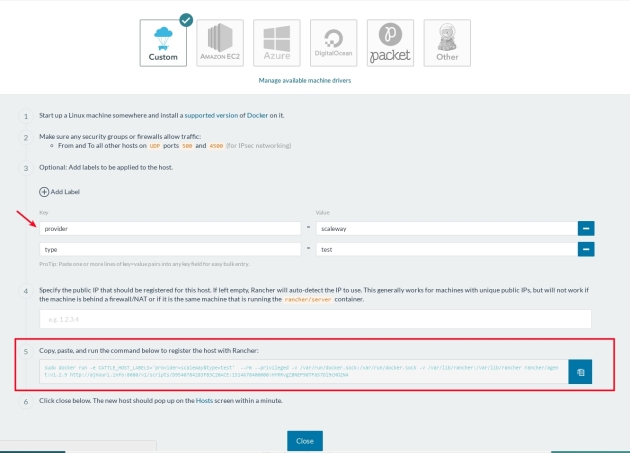
Rancher supports many cloud provider drivers. In our case, we will choose “Custom” deployment because I already have two scaleway machines.
So All we have to do to add a new node is to add any eventual labels (for futur scheduling) and copy the generated command, which is nothing but rancher agent container that needs to be run on the node:
SSH to each node using your private key and pate the command to make the node join the cluster
root@scw-e9ba84:~# sudo docker run -e CATTLE_HOST_LABELS='provider=scaleway&type=test' --rm --privileged -v /var/run/docker.sock:/var/run/docker.sock -v /var/lib/rancher:/var/lib/rancher rancher/agent:v1.2.9 http://ajnouri.info:8080/v1/scripts/D9540784283FB3C20ACE:1514678400000:HYRRvgZBNEP98TPa57Dl9cMO2N4
Unable to find image 'rancher/agent:v1.2.9' locally
v1.2.9: Pulling from rancher/agent
b3e1c725a85f: Pull complete
6a710864a9fc: Pull complete
d0ac3b234321: Pull complete
87f567b5cf58: Pull complete
063e24b217c4: Pull complete
d0a3f58caef0: Pull complete
16914729cfd3: Pull complete
dc5c21984c5b: Pull complete
d7e8f9784b20: Pull complete
Digest: sha256:c21255ac4d94ffbc7b523f870f2aea5189b68fa3d642800adb4774aab4748e66
Status: Downloaded newer image for rancher/agent:v1.2.9

INFO: Running Agent Registration Process, CATTLE_URL=http://ajnouri.info:8080/v1
INFO: Attempting to connect to: http://ajnouri.info:8080/v1
INFO: http://ajnouri.info:8080/v1 is accessible
INFO: Inspecting host capabilities
INFO: Boot2Docker: false
INFO: Host writable: true
INFO: Token: xxxxxxxx
INFO: Running registration
INFO: Printing Environment
INFO: ENV: CATTLE_ACCESS_KEY=B59CC532FAAEDCE3D8F7
INFO: ENV: CATTLE_HOME=/var/lib/cattle
INFO: ENV: CATTLE_HOST_LABELS=provider=scaleway&type=test
INFO: ENV: CATTLE_REGISTRATION_ACCESS_KEY=registrationToken
INFO: ENV: CATTLE_REGISTRATION_SECRET_KEY=xxxxxxx
INFO: ENV: CATTLE_SECRET_KEY=xxxxxxx
INFO: ENV: CATTLE_URL=http://ajnouri.info:8080/v1
INFO: ENV: DETECTED_CATTLE_AGENT_IP=51.15.239.154
INFO: ENV: RANCHER_AGENT_IMAGE=rancher/agent:v1.2.9
INFO: Launched Rancher Agent: fa0ca3d03e7946b57a0c5b1b7f9042553e2d7d5ef47aba369822fae5eb28d751
root@scw-e9ba84:~#
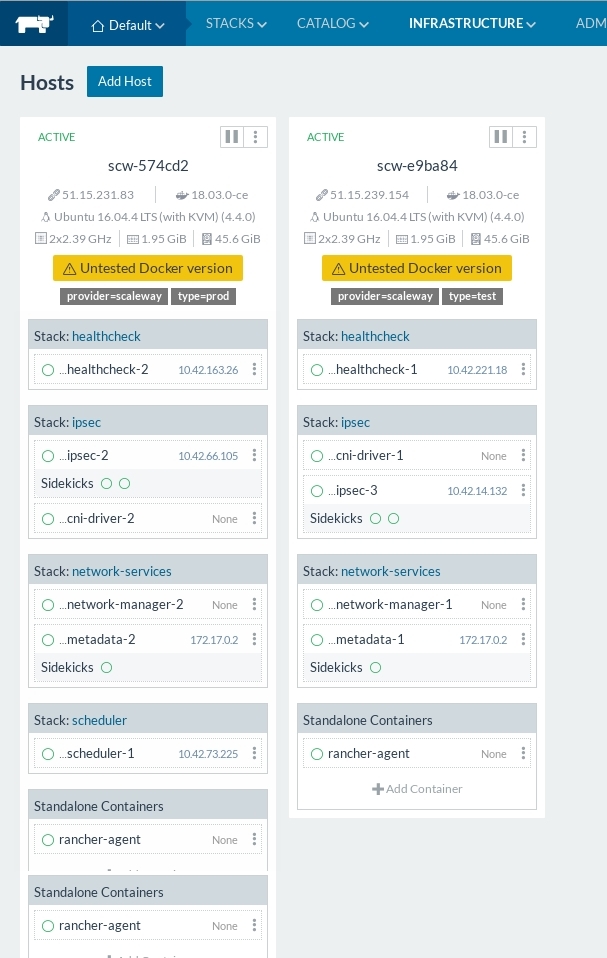
Now you can see both nodes in Rancher:
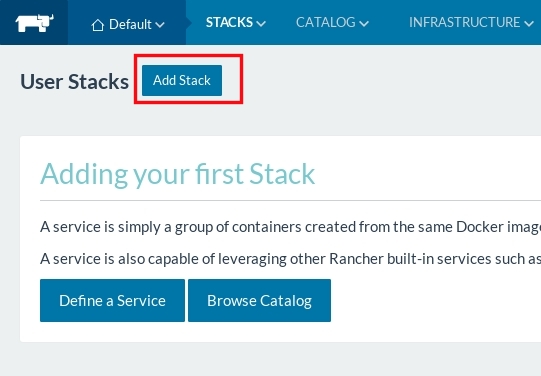
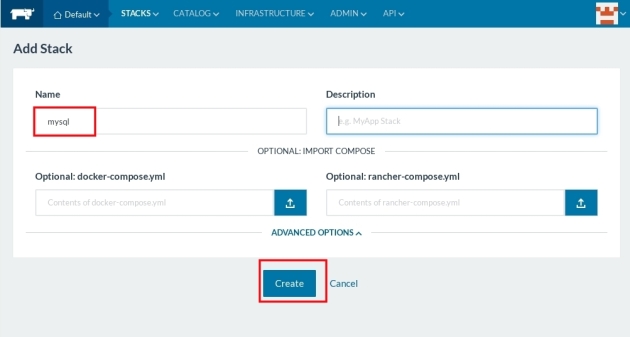
Starting mysql service
Now that the nodes has joined the cluster, create a stack, and configure mysql service
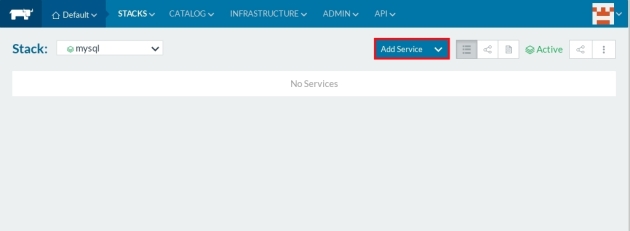

wait a couple of seconds until the service is UP
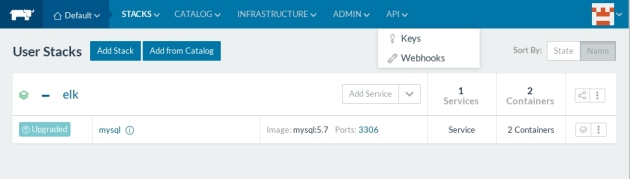
The service will be deployed on one of the nodes:
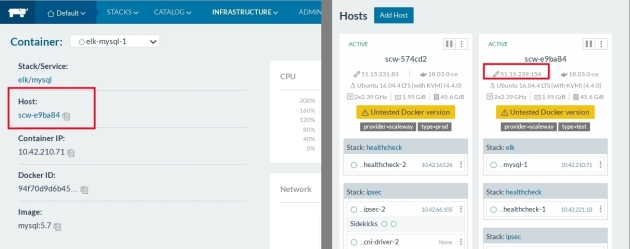
Check mysql service availability:
nc -zv 51.15.239.154 3306
Connection to 51.15.239.154 3306 port [tcp/mysql] succeeded!
Loading a fake mysql database
Using the following script, fill the mysql server with the fake database:
cat build.sh
mysql -h 51.15.239.154 -u root -p"passwd" -Bse "create database employees;"
mysql -h 51.15.239.154 -u root -p"passwd" -Bse "create database employees;" -u root -p"passwd" -Bse "show databases;"
mysql -h 51.15.239.154 -u root -p"passwd" "employees" < "employees.sql"
$ ./build.sh
ERROR 1007 (HY000) at line 1: Can't create database 'employees'; database exists
INFO
CREATING DATABASE STRUCTURE
INFO
storage engine: InnoDB
INFO
LOADING departments
INFO
LOADING employees
INFO
LOADING dept_emp
INFO
LOADING dept_manager
INFO
LOADING titles
INFO
LOADING salaries
data_load_time_diff
00:02:27
Running ELK stack containers
In a new directory create “data” and “config-dir” and “plugin” sub-directrories and create the following docker-compose.yaml file:
$ mkdir data && mkdir config-dir && mkdir plugin
$ cat docker-compose.yml
version: '3'
services:
 elasticsearch:
   image: elasticsearch
   ports:
     - "9200:9200"
     - "9300:9300"
   volumes:
     - ./data:/usr/share/elasticsearch/data
 mylogstash:
   build:
     context: .
     dockerfile: Dockerfile
   volumes:
     - ./config-dir:/mylogstash/config-dir:rw
     - ./data:/mylogstash/data:rw
     - ./plugin:/mylogstash/plugin:rw
   ports:
     - "5000:5000"
   tty: true
   command: ["bash"]
   links:
     - elasticsearch
 kibana:
   image: kibana
   ports:
     - "5601:5601"
   links:
     - elasticsearch
run docker-compose:
$ docker-compose up -d
Creating network "elkmysql_default" with the default driver
Creating elkmysql_elasticsearch_1 ... done
Creating elkmysql_mylogstash_1 ... done
Creating elkmysql_kibana_1 ... done
ajn@~/labs/elk-mysql$
Check the running containers:
 docker-compose ps
 Name Command State Ports
------------------------------------------------------------------------------------------------------------------
elkmysql_elasticsearch_1 /docker-entrypoint.sh elas ... Up 0.0.0.0:9200->9200/tcp, 0.0.0.0:9300->9300/tcp
elkmysql_kibana_1 /docker-entrypoint.sh kibana Up 0.0.0.0:5601->5601/tcp
elkmysql_mylogstash_1 /docker-entrypoint.sh bash Up 0.0.0.0:5000->5000/tcp
Configuring the pipeline on Logstash
Connect to logstash container:
$ docker exec -ti elkmysql_mylogstash_1 bash
root@00e9048cbdec:/#
Download the plugin file “mysql-connector-java-5.1.23-bin.jar” into “plugin” directory
root@00e9048cbdec:/# cd mylogstash/plugin/
root@00e9048cbdec:/mylogstash/plugin# wget http://www.java2s.com/Code/JarDownload/mysql/mysql-connector-java-5.1.23-bin.jar.zip
--2018-04-28 14:49:40-- http://www.java2s.com/Code/JarDownload/mysql/mysql-connector-java-5.1.23-bin.jar.zip
Resolving www.java2s.com (www.java2s.com)... 45.40.136.91
Connecting to www.java2s.com (www.java2s.com)|45.40.136.91|:80... connected.
HTTP request sent, awaiting response... 200 OK
Length: 806066 (787K) [application/zip]
Saving to: ‘mysql-connector-java-5.1.23-bin.jar.zip’

mysql-connector-java-5.1.23-bin.j 100%[============================================================>] 787.17K 452KB/s in 1.7s

2018-04-28 14:49:42 (452 KB/s) - ‘mysql-connector-java-5.1.23-bin.jar.zip’ saved [806066/806066]

root@00e9048cbdec:/mylogstash/plugin# ls
mysql-connector-java-5.1.23-bin.jar.zip
root@00e9048cbdec:/mylogstash/plugin# unzip mysql-connector-java-5.1.23-bin.jar.zip
Archive: mysql-connector-java-5.1.23-bin.jar.zip
 inflating: mysql-connector-java-5.1.23-bin.jar
root@00e9048cbdec:/mylogstash/plugin# rm *.zip
Create a logstash pipeline configuration file (ex: mysql.conf) inside “config-dir”
root@00e9048cbdec:/# cat mylogstash/config-dir/mysql.conf
input {
  jdbc {
    jdbc_driver_library => "/mylogstash/plugin/mysql-connector-java-5.1.23-bin.jar"
    jdbc_driver_class => "com.mysql.jdbc.Driver"
    jdbc_connection_string => "jdbc:mysql://192.168.0.146:3306/employees"
    jdbc_user => "root"
    jdbc_password => "passwd"
    statement => "SELECT * FROM employees"
    schedule => "* * * * *" jdbc_paging_enabled => "true"
    jdbc_page_size => "50000"
  }
}
filter {}
output {
  elasticsearch {
    hosts => [ "elasticsearch:9200" ]
    "document_type" => "data"
    "index" => "fakemysql"
    http_compression => true
  }
}
For the sake of simplicity, no filter is configured, but in production, to optimize the data analysis and queries, you’ll need to structure the data using filters.
Start logstash with the configuration file “mysql.conf”
root@00e9048cbdec:/# logstash -f /mylogstash/config-dir/mysql.conf --config.reload.automatic

After a couple of seconds, you’ll start to see logstash fetching database data by chunks of 5000:
 INFO logstash.inputs.jdbc - (0.006000s) SELECT version()
14:53:00.982 [Ruby-0-Thread-18: /usr/share/logstash/vendor/bundle/jruby/1.9/gems/rufus-scheduler-3.0.9/lib/rufus/scheduler/jobs.rb:283] INFO logstash.inputs.jdbc - (0.178000s) SELECT count(*) AS `count` FROM (SELECT * FROM employees) AS `t1` LIMIT 1
14:53:01.124 [Ruby-0-Thread-18: /usr/share/logstash/vendor/bundle/jruby/1.9/gems/rufus-scheduler-3.0.9/lib/rufus/scheduler/jobs.rb:283] INFO logstash.inputs.jdbc - (0.140000s) SELECT * FROM (SELECT * FROM employees) AS `t1` LIMIT 50000 OFFSET 0
14:53:31.619 [Ruby-0-Thread-18: /usr/share/logstash/vendor/bundle/jruby/1.9/gems/rufus-scheduler-3.0.9/lib/rufus/scheduler/jobs.rb:283] INFO logstash.inputs.jdbc - (0.165000s) SELECT * FROM (SELECT * FROM employees) AS `t1` LIMIT 50000 OFFSET 50000
14:53:57.572 [Ruby-0-Thread-18: /usr/share/logstash/vendor/bundle/jruby/1.9/gems/rufus-scheduler-3.0.9/lib/rufus/scheduler/jobs.rb:283] INFO logstash.inputs.jdbc - (0.215000s) SELECT * FROM (SELECT * FROM employees) AS `t1` LIMIT 50000 OFFSET 100000
Analysing data with Kibana
Browse Kibana web interface at 127.0.0.1:5601

You’re prompt to indicate the index pattern the data you’re looking for.
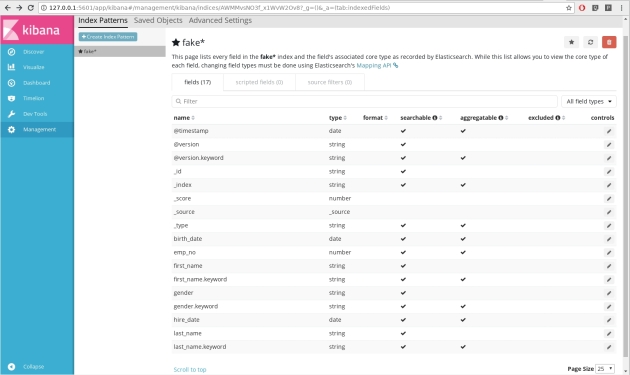
Remember logstash configuration “index” => “fakemysql”. Enter the entire word or use a wildcard.
Kibana will start showing every field in the index :
Elasticsearch starts receiving the index and showing them in discover section
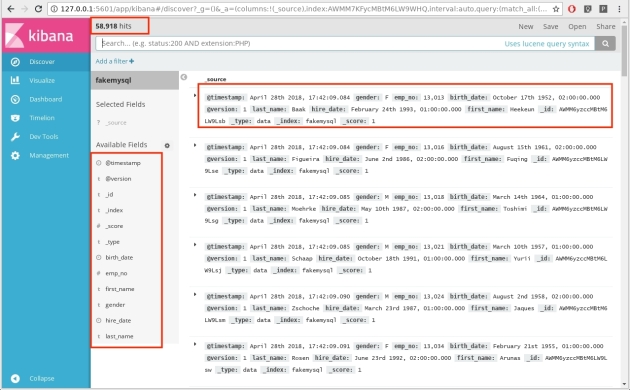
And after a couple of minutes:

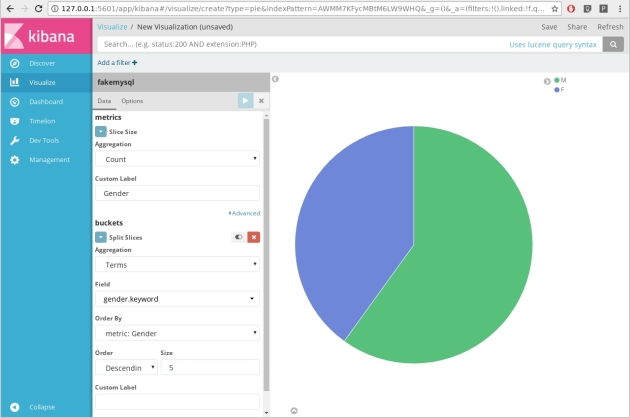
You can already play with the data in the Visualize section:
For example, visualize gender percentages among employees:
After reading the entire database we need to fetch only new informations, in logstash jdbc plugin, replace the mysql query
statement => "SELECT * FROM employees"
with
statement => "SELECT" * FROM employees where Date > :sql_last_value order by Date"
More ELK stack labs to come …
Stay tuned!


